During Integrate conference about six months ago, Microsoft showed us the work they had been doing to add debugging capabilities for polices in API Management. This was in private preview back then, but at Ignite earlier this month the public preview was released.
So why is this such an important capability?
One of the main issues with SAAS services in general is, although you can extend the functionality, that code is difficult to diagnose issues. In API management you can do all kinds of cool things in policies, but as a policy is executed in the context of the API Management engine, you cannot easily debug it. Often you end up with a policy stuffed with trace statements to figure out the value of a certain variable. A policy typically consists of a combination of XML and C#. The C# part sometimes can be tested in a console app, but you won't have the APIM context variables so this often is not sufficient.
Let me be clear, don't turn your API Management instance into an ESB by loading it with business logic, but policies can be really helpful for small conversions and other pieces of logic. Having the capability to debug and step through a policy is going to save a lot of time, but don't move code to your APIM layer that should be in a Function.
Debugging a policy
The first step to enable debugging a policy is installing the Visuals Studio Code extension. This extension is really helpful for managing your APIM instance in general. It already contained intellisense for writing polices and is now extended with policy debugging.
When installed, you can select the ‘Azure’ icon to open the API Management blade. After logging into your Azure subscription, you can browse through your entire APIM resource.
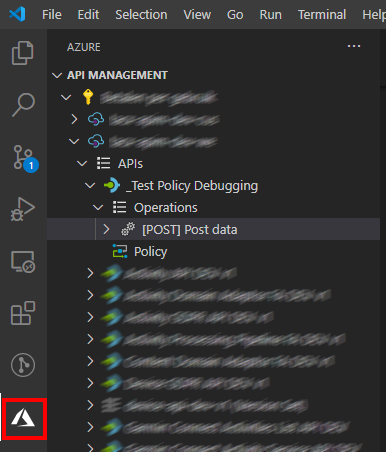
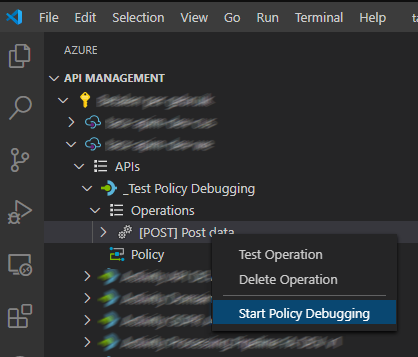
Policies are executed as part of a call to an operation. To debug a policy, you need to select an operation to which you want to send a request. This request will pass through the policies on tenant, product, api and operation level.
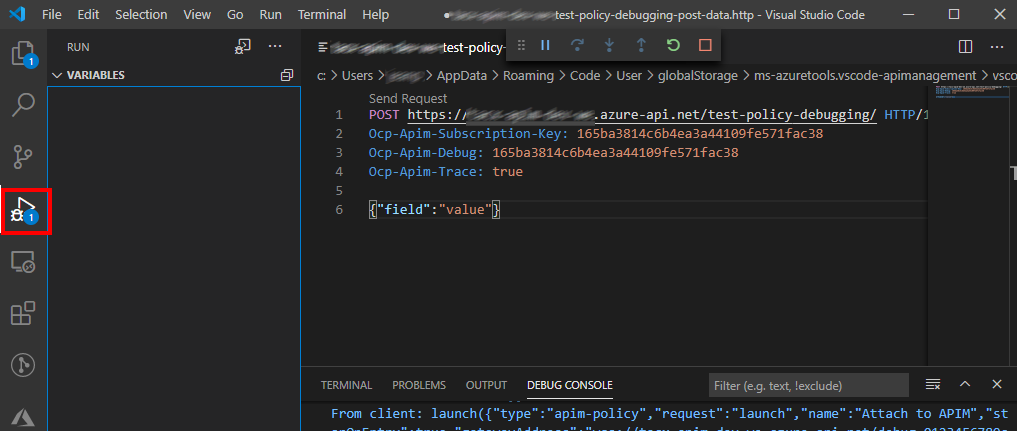
When initiating a debugging session, a window is opened from where you can directly send a request. You also can switch to the debug window to view the context variables and other related values.
When you click ‘Send request’ the debugging session starts and waits at the first statement. You can use the regular debugging shortcut keys you're used to in Visual Studio Code, like F10 to step over a statement. In the screenshot below you'll see the policies are executed from the lowest level, so first the operation level policy (see set-header name).
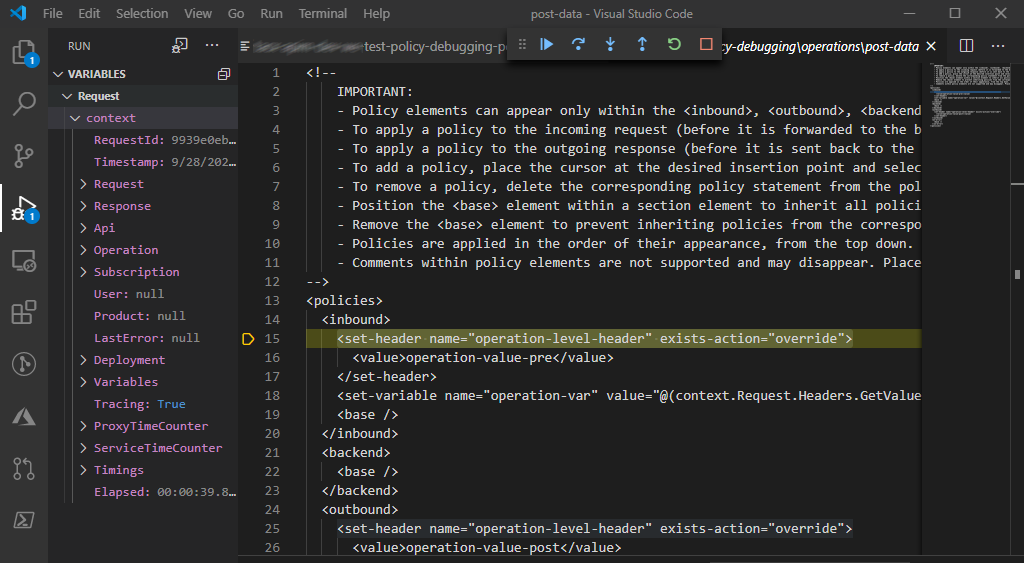
When you step through the policy you'll go through the policies at other levels, starting with API level and then further up via Product to Tenant level.
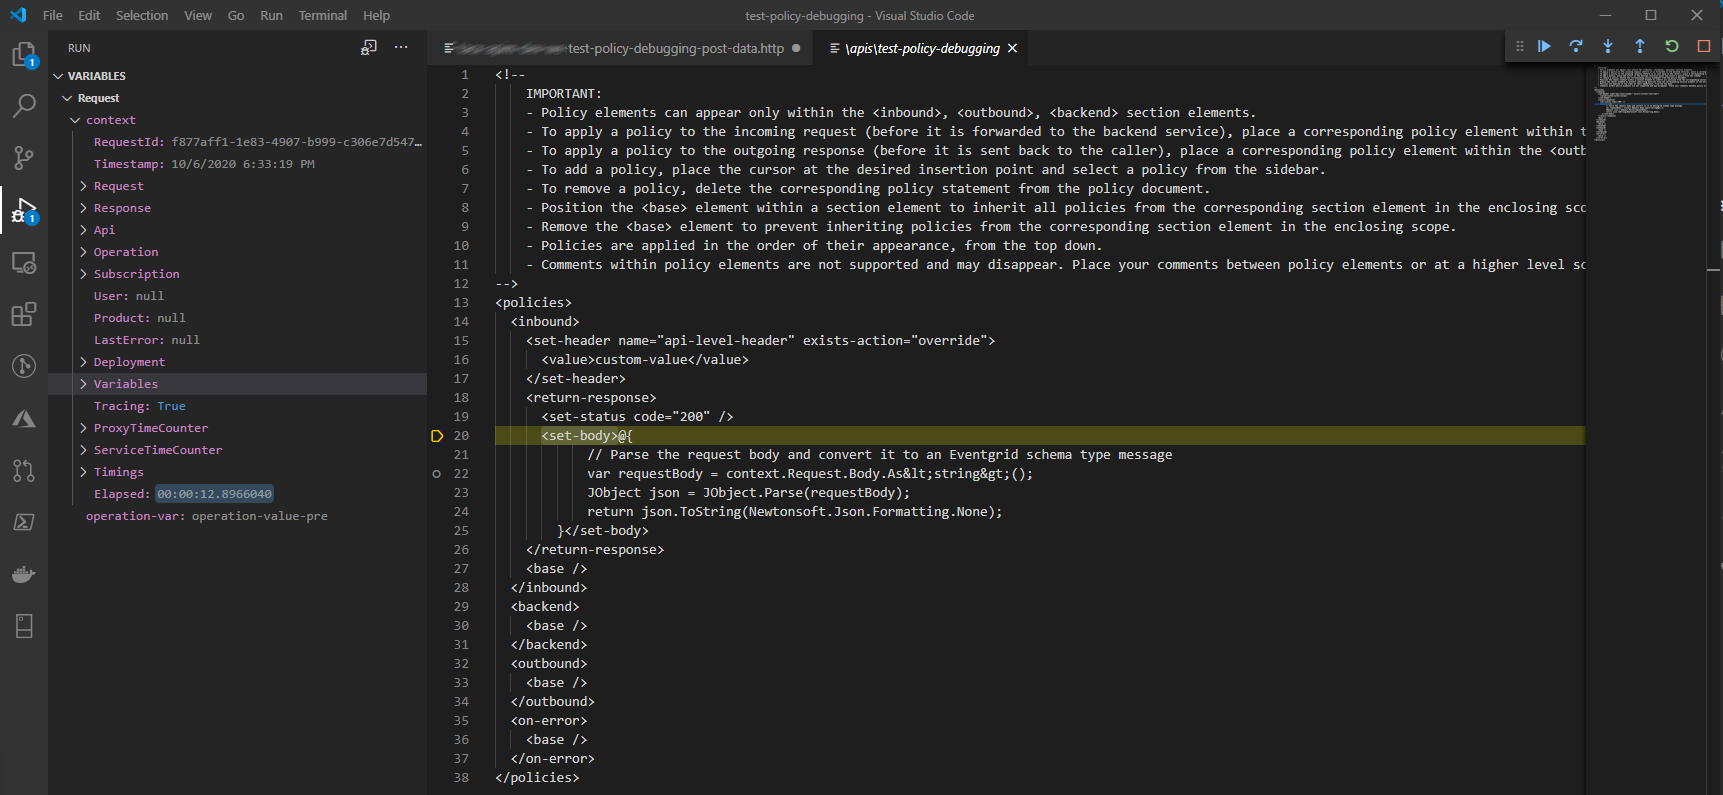
At the bottom of the variables window, you can see the variable set by the Operation policy executed earlier (named operation-var). In this screenshot the debugger is stopped at the set-body policy. There I found out the expression itself cannot be debugged, but will be stepped over as one single statement.
Good start
So although this is a great start, I found a couple of things lacking that I did expect to find in this public preview:
- Variables window is not displaying the HTTP header values set on the request
- Debugging the C# expressions in the policy is not working yet. You can use a subset of C# in a policy, and it would be really valuable to be able step into it, but currently it'll just step over that part.
Closing note: As long as the debugging capability is in preview, it will only available on the developer tier.